Stock Markets: What return can be expected over the long run?
Forecasting short-term fluctuations in the stock markets is a favorite pastime of many investors. The fact is, however, that this is a futile exercise, as these fluctuations are often random and impossible to predict successfully on a recurring basis.
For an investor with a longer investment horizon, however, it is possible to anchor return expectations on much more concrete parameters.
The past decade has been particularly favorable for equities. For example, the S&P 500 index in the United States recorded an annualized return of 13.6% over this period.
The price of a share corresponds to the earnings per share of the company concerned times the multiple that investors are willing to pay for these earnings:
- P (price) = E (earnings per share) x P/E (multiple)
For P (share price) to increase, therefore, E (earnings per share) must increase and/or P/E (multiple) must increase.
The table below shows the decomposition of the S&P 500 index return over the last decade based on this observation. Starting on the left, we can see that the sales of the 500 companies in this index have increased by an average of 3.9%. Over the same period, these companies have managed to significantly increase their profit margin (by reducing costs, for example), so that their profits have risen significantly more than their sales (7.4%). Moreover, these same companies invested relatively little and were therefore able to use a significant portion of their cash flow to buy back their shares. The low level of interest rates was another factor in this share buyback phenomenon. As a result, the number of shares outstanding decreased, and earnings per share increased more than earnings (8.9%).
Decomposition of the S&P 500 return over the last decade

Source: Standard & Poor’s, Thomson Financial, Credit Suisse
If by the end of 2019, investors had paid the same multiple for these profits as at the end of 2009, the story would have ended there. The return on the S&P 500 would have been 8.9%, plus dividends. However, another favorable element was added with the increase in multiples. In other words, by the end of 2019 investors were willing to pay more for these earnings, which added another 2.2% to the annualized return.
The value of this exercise, however, is not to look back but to provide a framework and discipline to anchor expectations for future returns. For each of the components that determine these returns, an investor should be aware of his assumptions:
The evolution of sales
The evolution of sales for companies as a whole is largely linked to that of the global economy. Growth in the global economy has slowed structurally since the financial crisis. Behind this slowdown are a multitude of factors, ranging from too high a level of debt, demographic trends and excessive regulation to increasing social inequalities. The Covid-19 shock seems to have further accelerated some of these factors. Of course, it could be that more pro-growth measures will be implemented, but the current political dysfunction and the rise of populism do not make one very optimistic about this. Another point to consider is that for mathematical reasons, the revenue growth of the main companies in the index (the technology companies) will sooner or later have to slow down (otherwise their sales would one day exceed GDP).
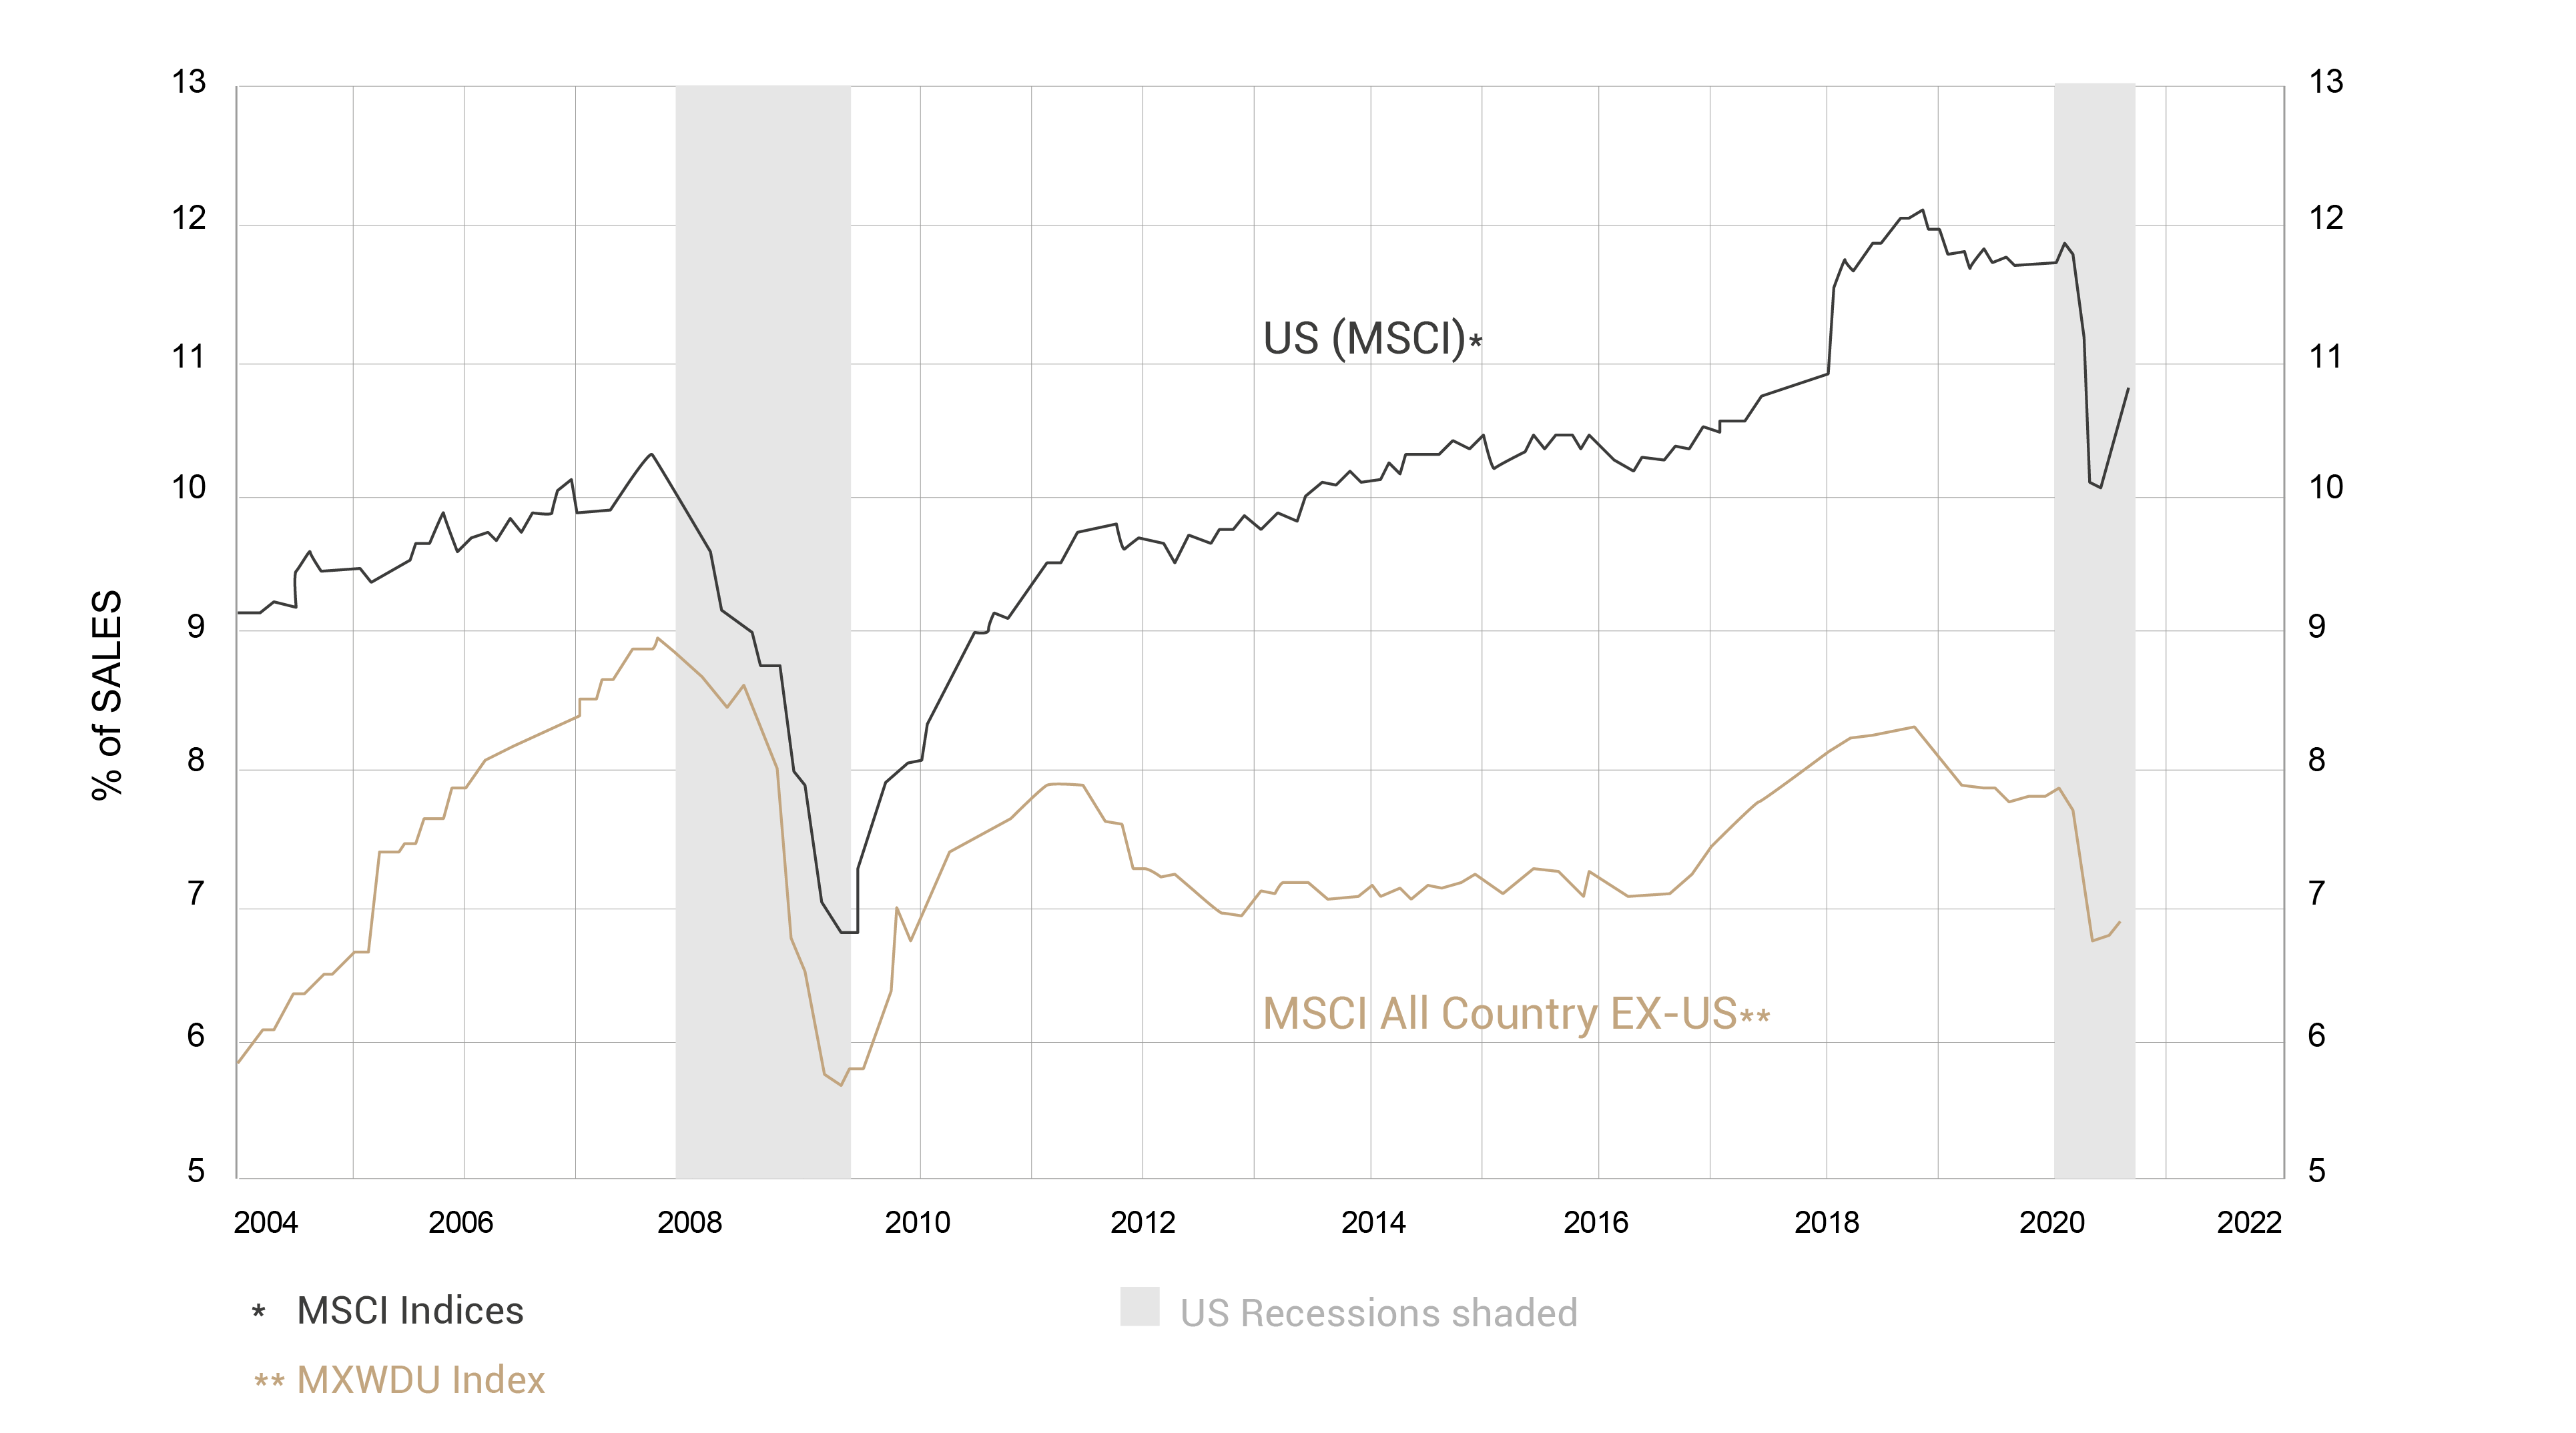
The evolution of profit margins
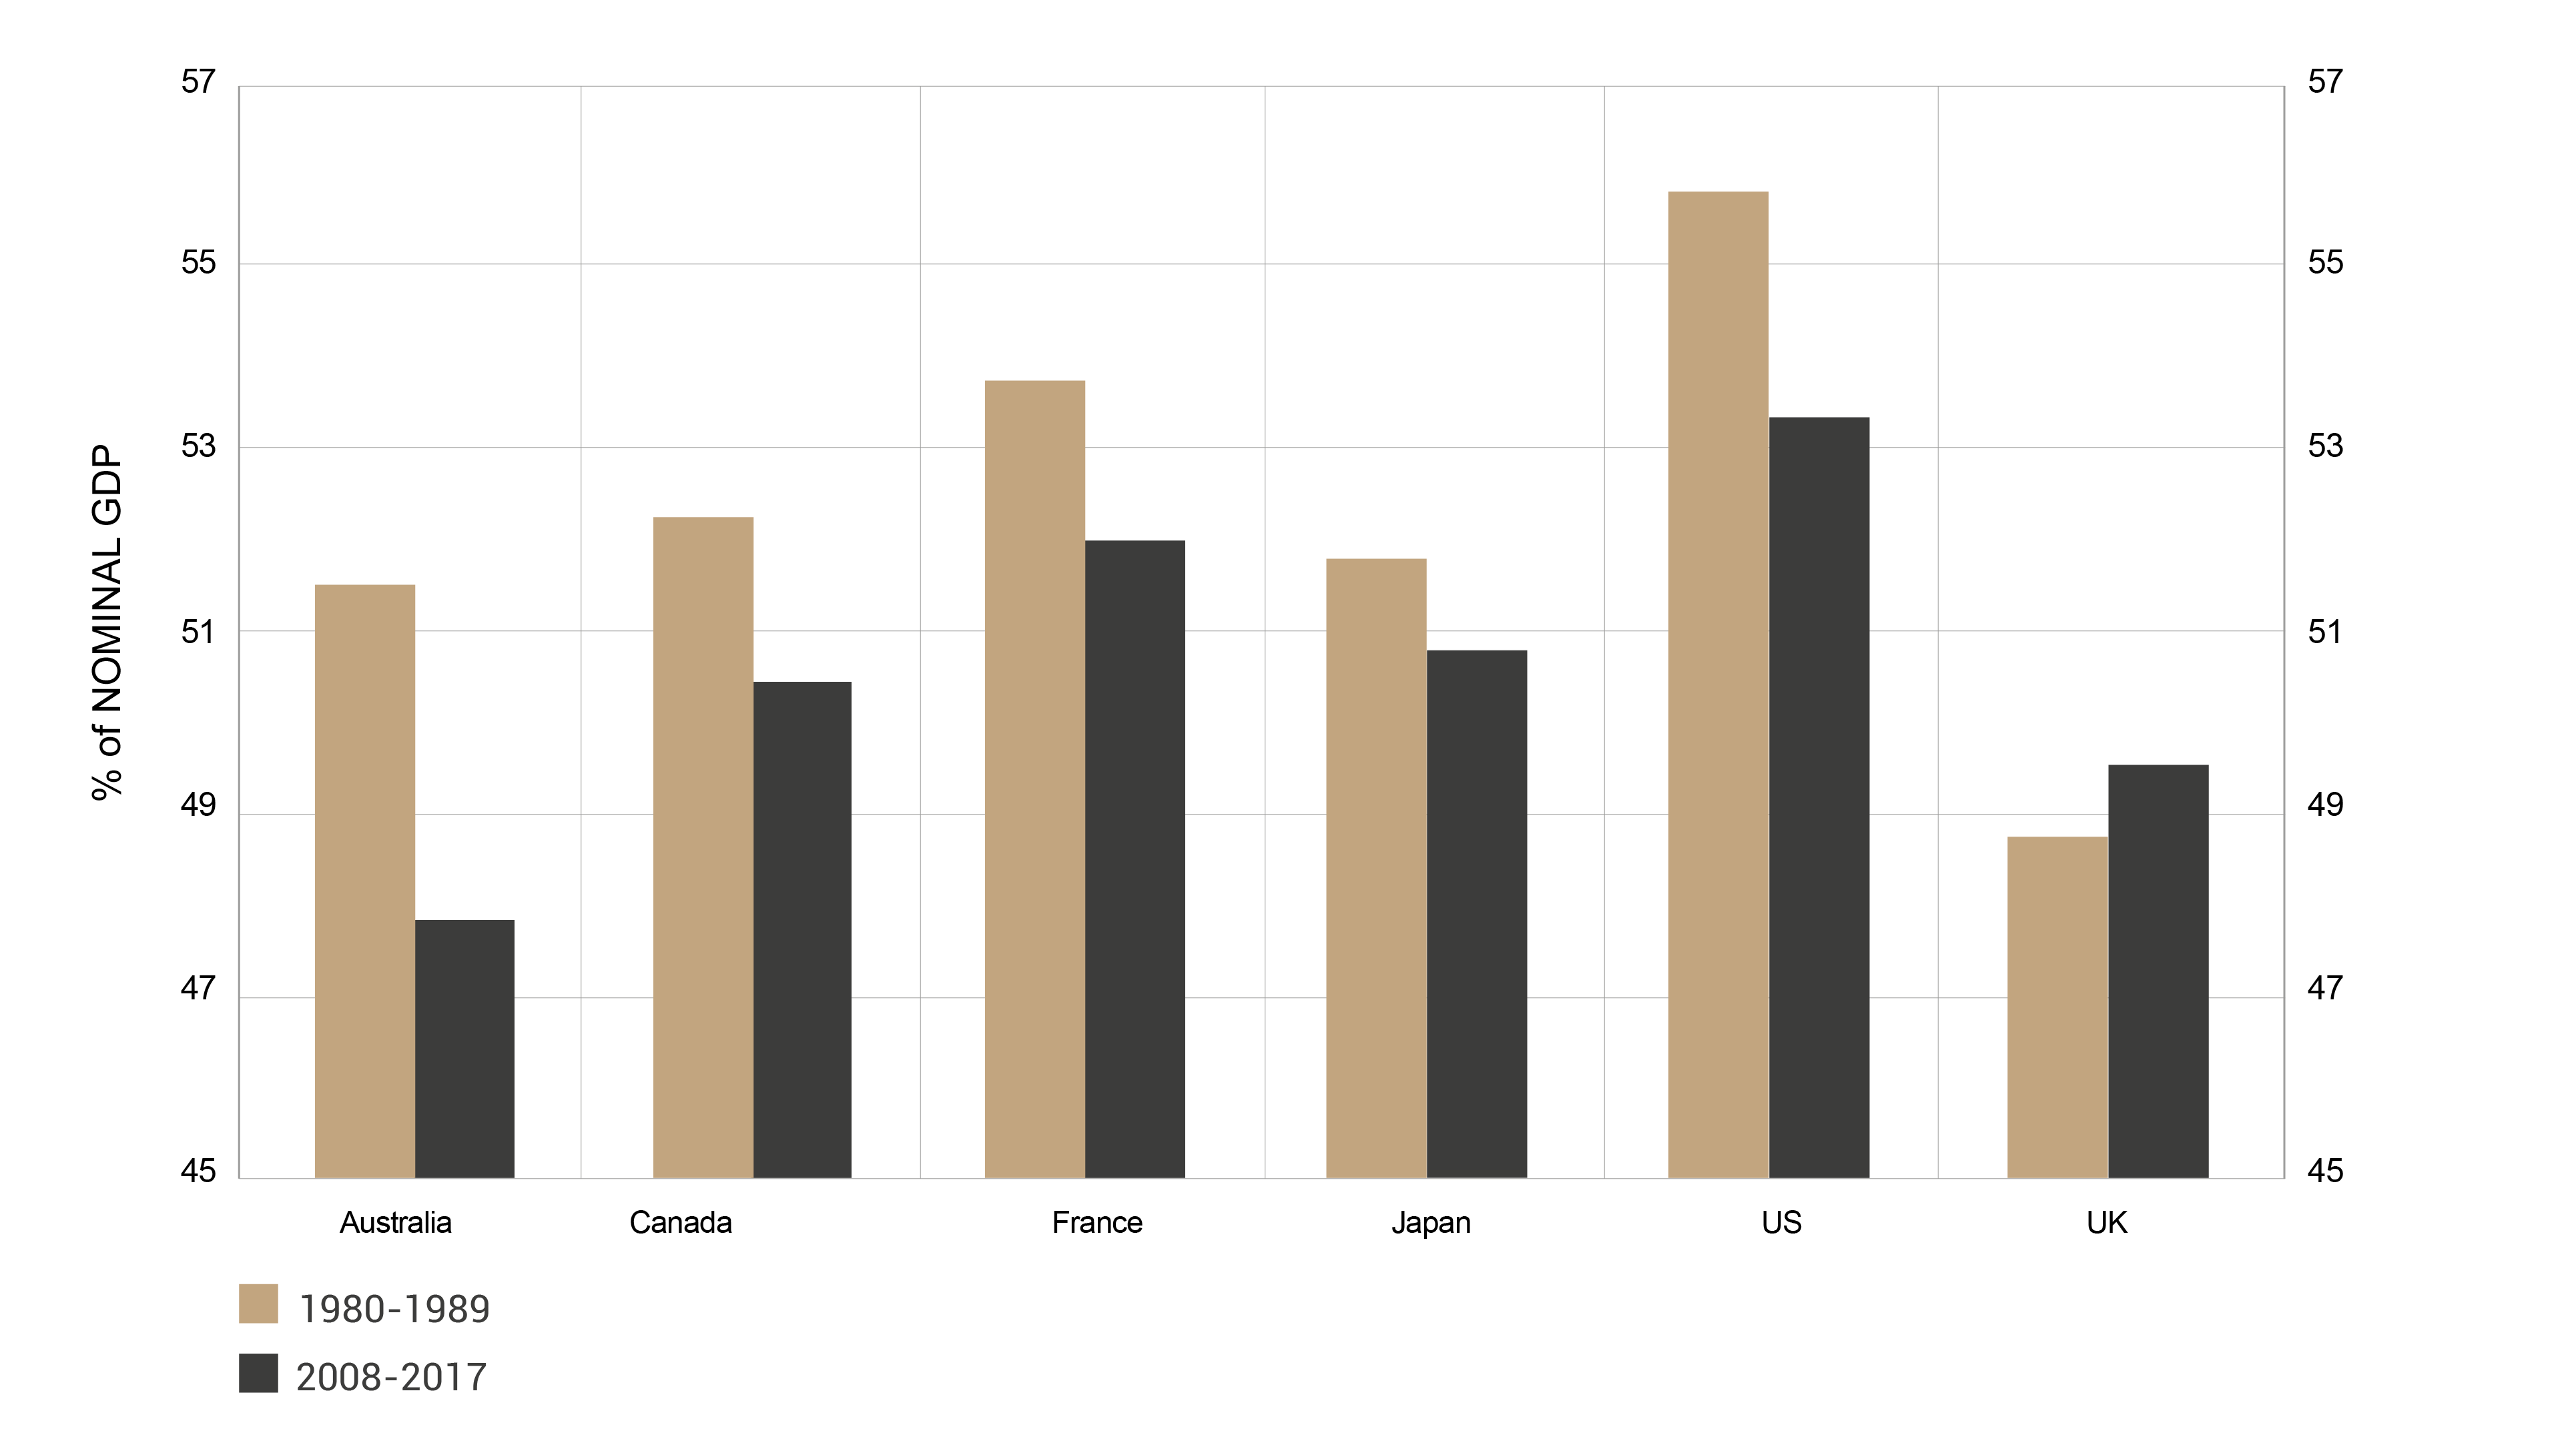
Can these margins increase further when they are already very high? This would mean that, to use Marxist terms, the fruits of growth continue to go mainly to capital, rather than to labor.
Wage share of nominal GDP, decade average

Source: OECD, Minack Advisors
One element that argues in favor of this is the continuation of technological development (in the broad sense, thus including trends such as robotization). Again, the Covid-19 shock could accelerate certain trends in this respect (increased use of technology, downsizing, ...). On the other hand, there is the realization that social inequalities have become too great and the rise of populism which could incite the authorities to pursue policies less favorable to the profit margins of companies. These could also be impacted by the rise of socially responsible investment (which could force companies to spend more on environmental protection and security, for example).
Profit margins (as a % of sales)

Source: MSCI, Datastream, NBER, Minack Advisors
Stock buybacks
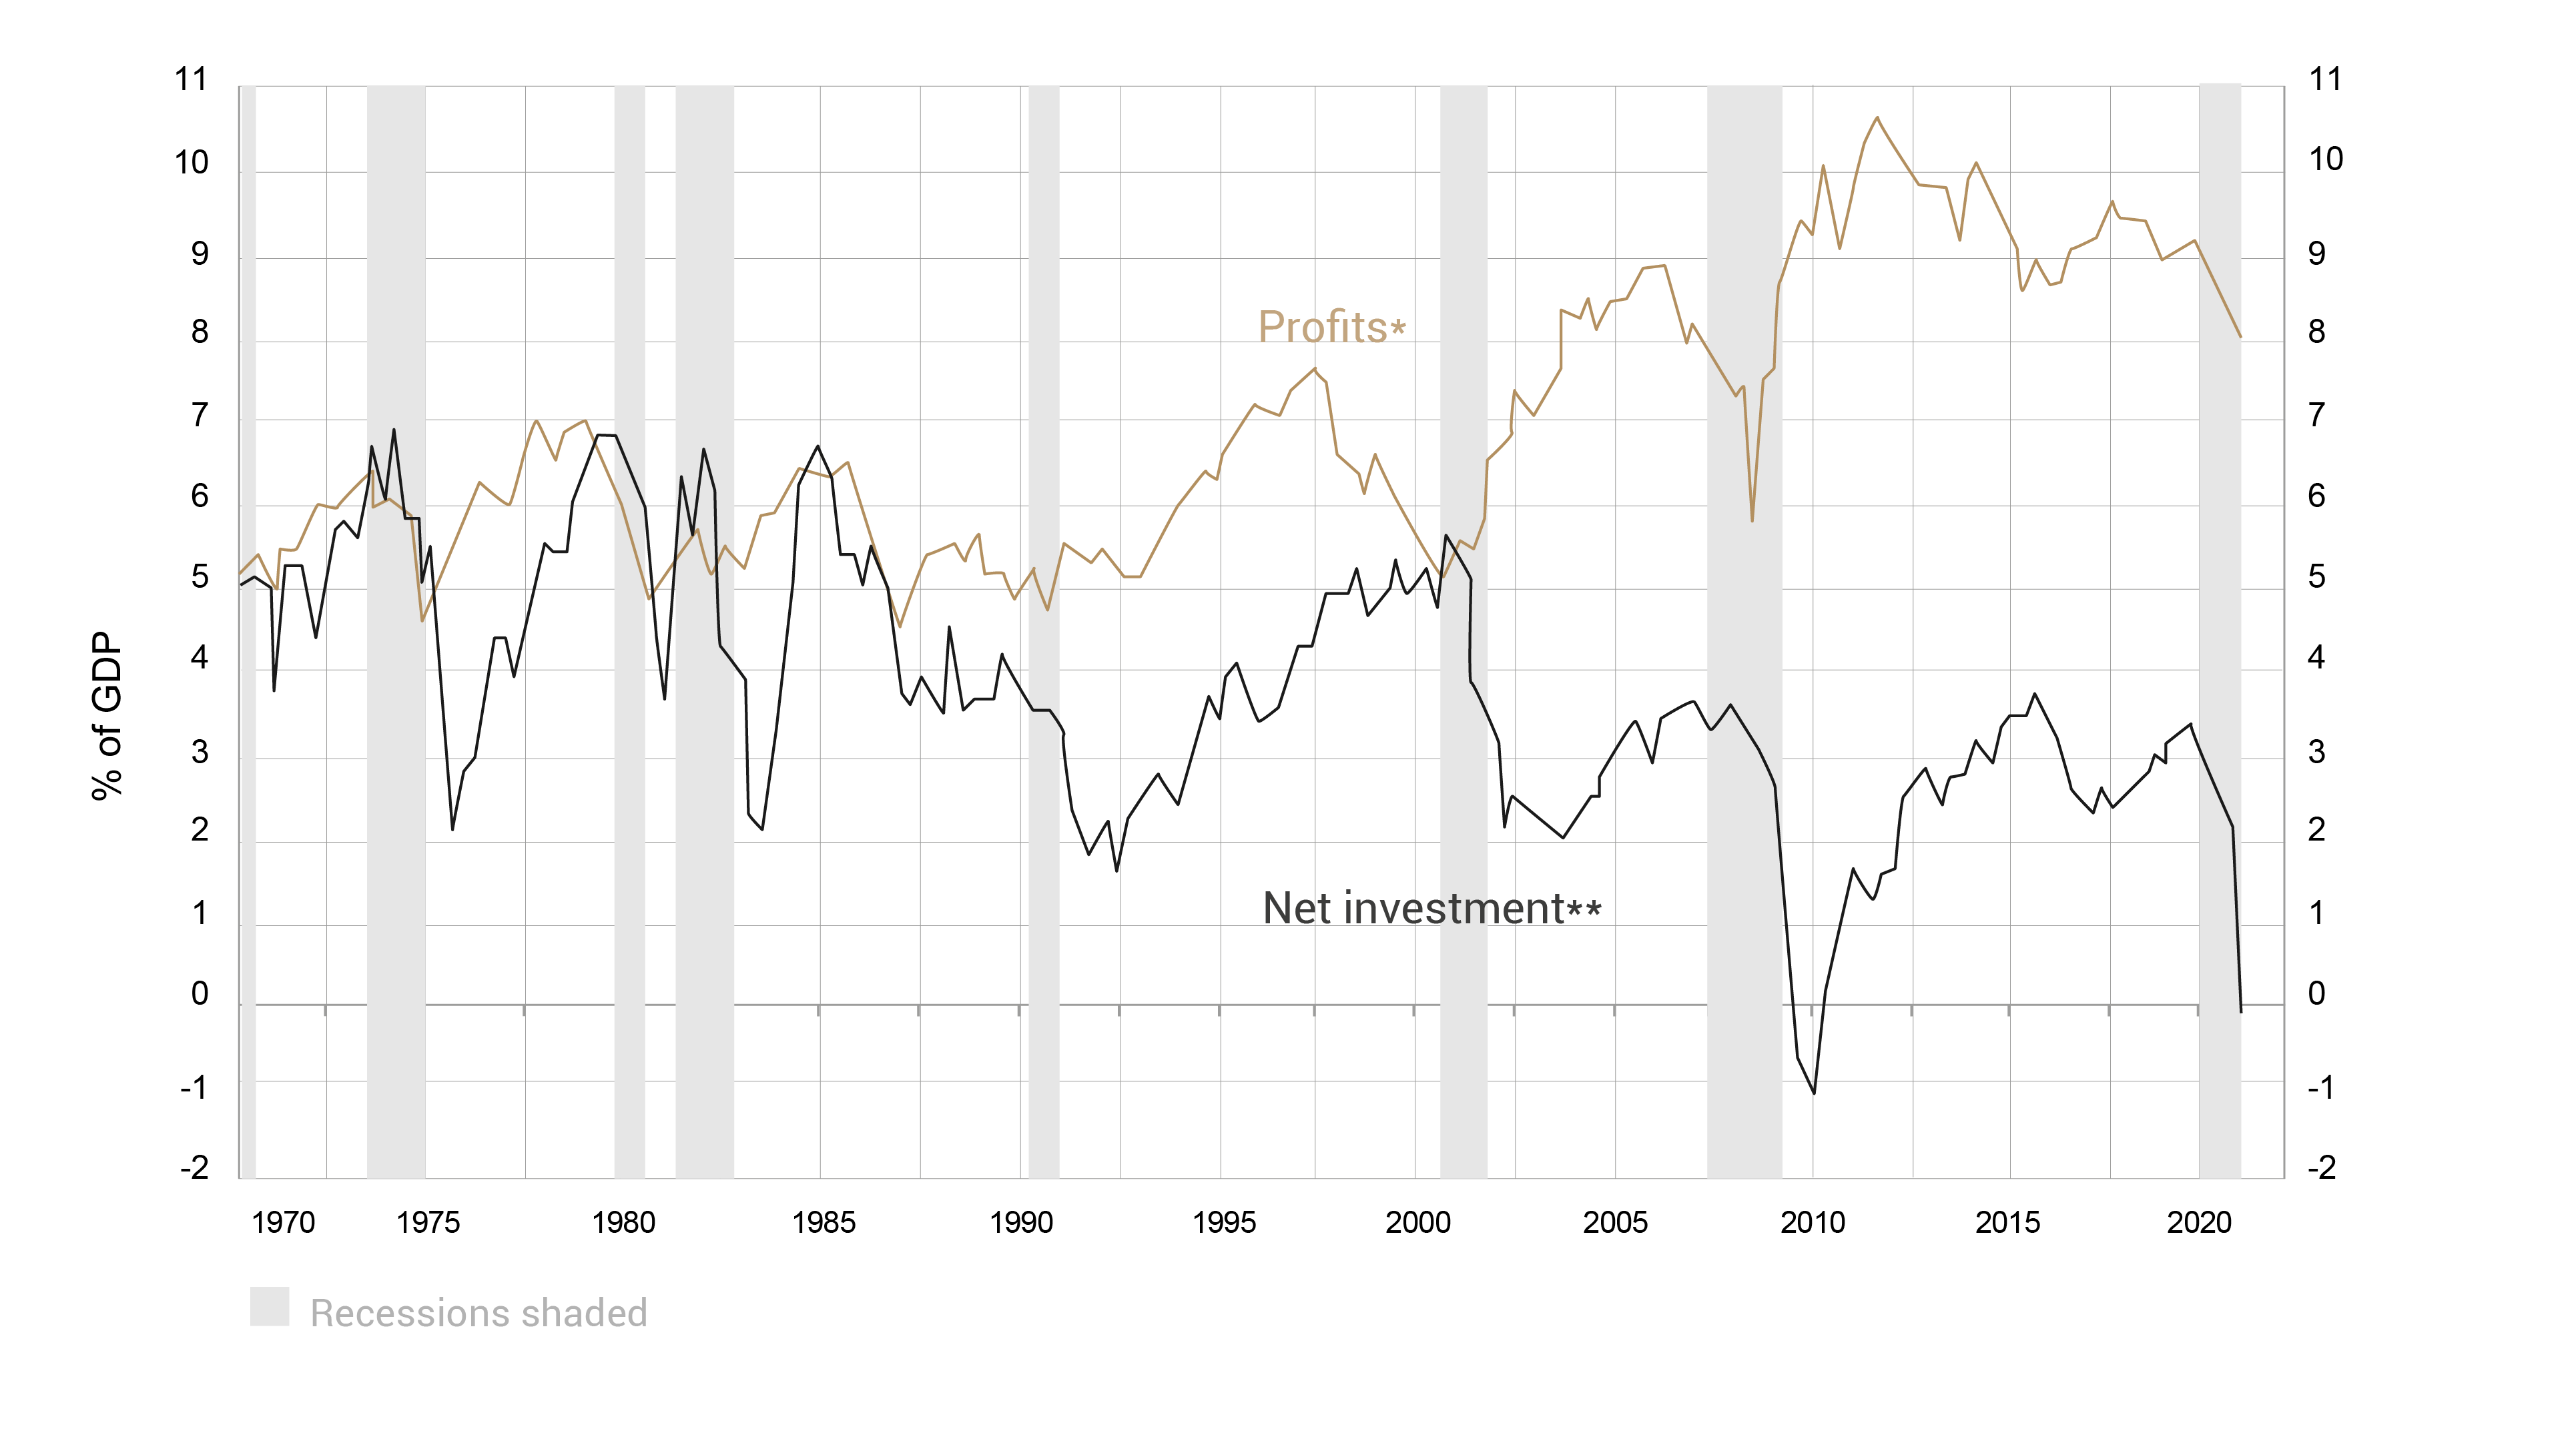
Will the passion for share buybacks continue? To a large extent, it will depend on the investment opportunities of companies. If these opportunities increase, there will be less cash available for share buybacks. If not, buybacks should continue, especially in the Anglo-Saxon countries where the shareholder value principle remains prevalent. For some industries, however, share buybacks will become much more politically sensitive. The example of the American airlines, which over the last few years have distributed nearly all their cash flow to their shareholders and then appealed to the state for help during the crisis, is edifying in this respect.
US profits and net investment as share of GDP

Source: BEA, BLS, NBER, Minack Advisors
The evolution of multiples
This is perhaps the most difficult component to predict, as it is partly influenced by psychological factors. Financial history shows that markets go through periods when some kind of collective optimism makes investors pay much higher multiples for equities, followed by periods of collective pessimism with much lower multiples. This being said, there are rational elements that influence these multiples, starting with the level of interest rates. Low rates increase the present value of future income (100 euros to be received in 2025 is worth more today if discounted at 5% than if discounted at 10%). In addition, low rates reduce the attractiveness of fixed-income investments, which are the main competitors of equities. Multiples are currently relatively high and a return to their long-term average would weigh on equity returns. If equity returns over the decade 2000-2009 have been disappointing, it is in large part because multiples were particularly high at the end of 1999. On the other hand, in the absence of a rise in interest rates, these multiples could remain high or even increase further.
In the foregoing, I have tried to provide some food for thought on each of the components that drive long-term equity performance. Each investor will have his or her own ideas on this. Opinions can range from the very positive (continued increases in profit margins and valuation multiples) to the very negative (a combination of declining earnings and multiples), but an investor should at least be aware of the assumptions inherent in his forecasts.


